Portfolio

I build interactive dashboards, clean messy datasets, and run data analysis, all to find the useful and practical insights hidden in data.

I work in Python (pandas, Plotly, Streamlit, scikit-learn), JavaScript, SQL, and HTML/CSS. I've merged and cleaned large-scale datasets, built classification pipelines, designed research experiments, and shipped data products that non-technical stakeholders have used.

If you need data turned into something visual, usable, and clear — let's talk.

AI Workforce Exposure Explorer

2026

An interactive tool for browsing how AI capabilities map onto the U.S. occupational task structure. Pick an occupation, work activity, or job category and see what share of the work current AI systems could affect — and how many workers and wage dollars sit behind that share.
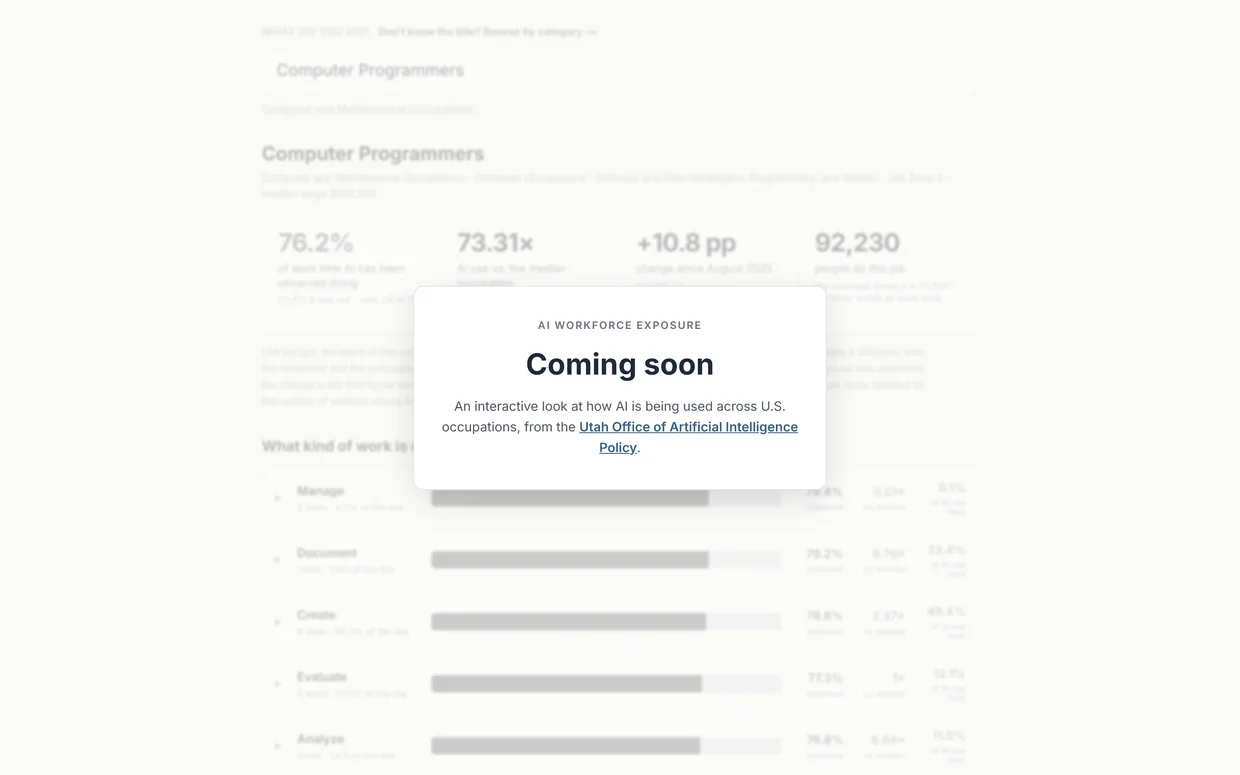
AI Workforce Exposure Explorer screenshot
  • —Browse exposure by occupation, work activity, and job category
  • —Trace how exposure shifts over time as capabilities change
  • —Ties each exposure figure back to headcount and wage totals
Fika

2026

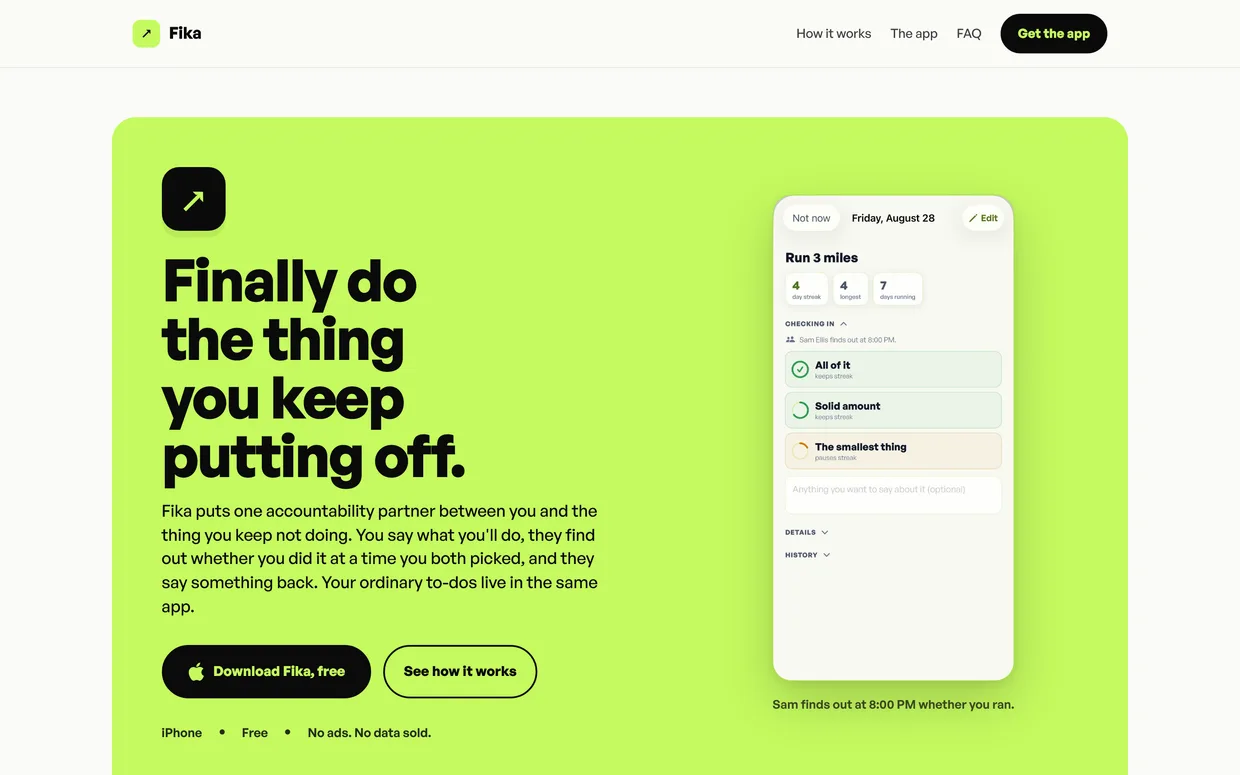
An accountability app for the thing you keep putting off. You make a specific promise, name one person as your witness, and check in with them at a time you set.

Fika screenshot
  • —Commitments with a named witness and a scheduled daily check-in
  • —Check-ins report honestly — all of it, a solid amount, or the smallest thing
  • —Streaks that count partial progress, plus a full task manager underneath

ReProof

2026

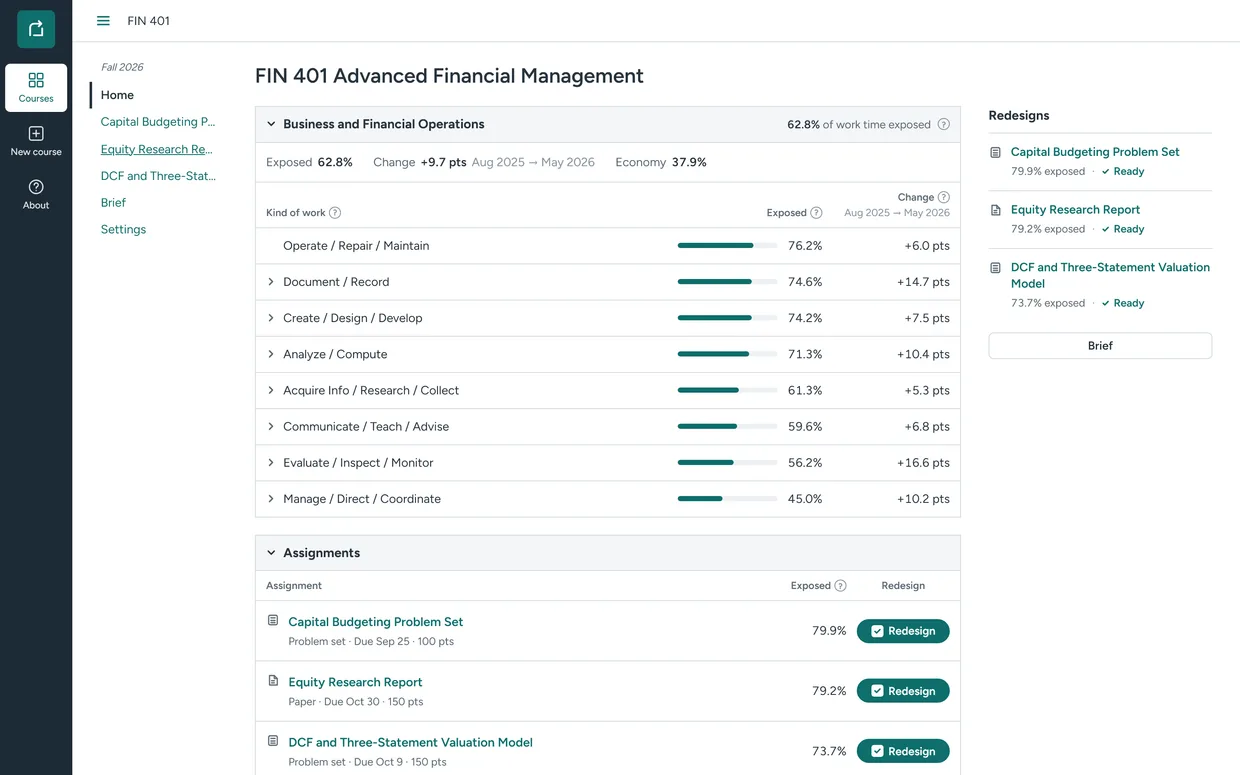
A hackathon build for professors. AI is making chunks of college coursework obsolete, and faculty have no practical way to tell which assignments are exposed. ReProof reads a course's syllabus and assignments, maps each one against real AI-usage data for the field its students are entering, and redesigns the most exposed assignments around the human skills AI doesn't cover — keeping the stated learning outcomes, explaining every change, and showing the Bloom's level before and after.

ReProof screenshot
  • —Maps course skills onto AI exposure built from Claude and Copilot usage data (Sept 2024–May 2026), BLS, O*NET and per-task time estimates
  • —Rewrites an assignment three ways, from lightly AI-aware to fully AI-infused, so the professor picks the posture they want
  • —Exports a one-page brief of course exposure and proposed changes, made to be handed round a faculty meeting

Macro Dashboard

2026

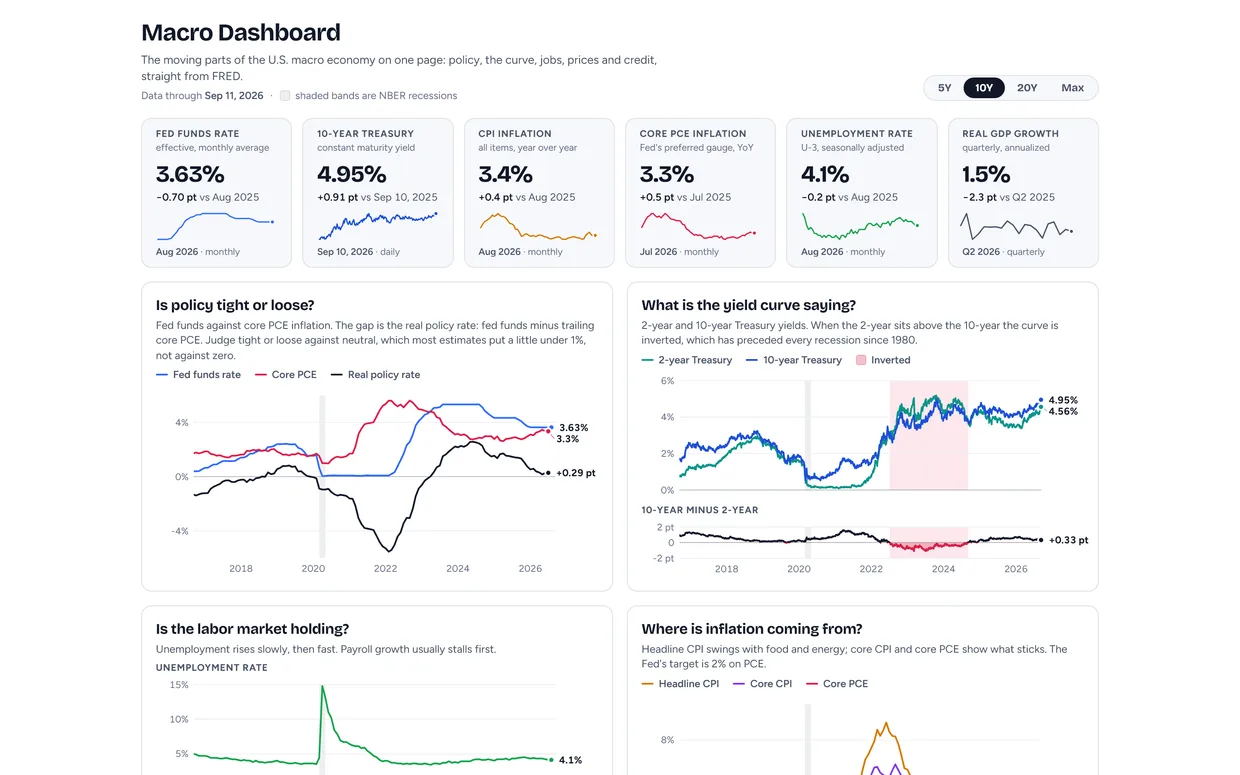
The moving parts of the U.S. macro economy on one page. Six headline numbers, five charts that each answer a single question, NBER recession shading on every series, one shared time window, and a table of exactly which FRED series everything came from.

Macro Dashboard screenshot
  • —Five question-led charts: is policy tight, what is the yield curve saying, is the labor market holding, where is inflation coming from, how tight are financial conditions
  • —Every number traces back to a named FRED series with its units, cadence, source agency, and last observation
  • —Refreshes itself every Monday via GitHub Actions; hand-rolled SVG charts, no charting library